Actin-Space- Challenge 2020: AIRBUS Fight for climate change with Earth Observation satellite data
Presentation
The creation of a global map of maritime CO2 emissions will support evidence-based policymaking. We believe it is essential to address climate change and reduce the carbon footprint of maritime transport, in order to promote sustainability through existing smart technology and satellite data.
The model supports the creation of a global map, identifying both the geographic concentrations and the accumulation over time of CO2 emissions from maritime transport and mining production areas, among others, that use bodies of water as raw materials. This will allow environmental policy formulation to be based on factual evidence, allowing greater contribution from national and regional authorities to support the regulatory efforts of the relevant bodies.
Project development
Our project aims to manage information obtained through satellite data in order to optimize the management of resources by collaborating with our clients to improve the decision-making process.
The satellite information we offer is organized in a structured way and aims to guide our clients towards rational, sustainable and sustainable mining and aquifer exploitation, preserving the care, development and diversity of natural and social ecosystems. It is also aimed at clients who have vessels in ports and fishing areas.
Our team is interdisciplinary ranging from engineers, chemists, biologists, computer/data sciences and social sciences. The interdisciplinary work tables allow for an in-depth evaluation of the data and the actors involved in the exploitation chain to generate deeper analyzes and achieve better and optimal results.
Market positioning
We are a software-based project whose main asset is knowledge. We will compete in the technology-based data market segment of the knowledge economy with those companies with their own and non-own satellite developments.
Our value proposition is to provide highly classified information contemplating the impact of our clients’ activity both on a resource scale and on an ecological and social scale. In this way, in addition to offering a satellite data service to improve decision-making about resources, we provide strong support and advice regarding the impact that these decisions could cause at a socio-ecological level so that clients and investors find in our clients companies with reliable, sustainable and sustainable projects.
In this sense, our service does not replace terrestrial information obtained from other sources of our clients, but rather complements it for greater effectiveness in decision making. Our vocation towards the market and our competitors is to grow collaboratively since we believe that, in a society committed to caring for the environment, we can innovate by developing new technologies and implement existing data from satellites through digitalization.
Product/service
The organization of this service consists of acquiring satellite images already processed through specialized software, so that our clients (companies in the sector and/or government organizations, for example) can develop more effective decision-making strategies with a positive impact. for the industry and the environment.
Initially, the tools provided by IBM Watson will be used to create models from Visual Recognition where the results of new images obtained can be compared and thus be able to classify them effectively based on already determined patterns.
In the future, it is planned, through machine learning, to process images with our codes and custom layers to obtain a better image indicating CO2, among other compounds, in ports and aquifers.
Sales strategy
Our sales strategy is through meetings with different actors in the mining and aquifer sector to inform about the importance of using satellite data to improve decision making and to have a positive image before society and investors.
On the other hand, generate meeting spaces with civil society actors to inform about the joint work that takes place with these companies in the sector to not only reduce the negative impact of these companies, but also to commit them to local development.
Projections
We would start at no cost because the initial data collection would be through public data and storing data on servers (cloud), which are free, but according to the client’s requirement, the indicated cloud will be used for their Big Data system.
Then we would move on to a phase, with a cost, where data through optical satellites (Airbus-Satellogyc) will allow us to improve the quality of that data and provide a higher performance service. Another cost in this phase would be to expand the storage but it would always be based on a criterion of customer demand, that is, transferring the cost of the cloud to the customer.
Since our project has a strong software base, we consider that in the first phase we would not have costs due to the use of public data, but in any case we have the possibility of resorting to similar, non-refundable credits, such as those from IBM to SMEs and start-ups, for example.
Furthermore, private companies will continue to exploit resources, so the idea is to generate projects and meeting spaces that promote and raise awareness about sustainability and care for the environment and the cultural environment through the management of information provided. by satellite data to make sustainable decisions.
Measurement Parameters
Space remote sensing is the technique that allows images of the Earth’s surface to be acquired from sensors installed on space platforms, assuming that there is an energetic interaction between the sensor and the Earth, either by reflection of solar energy (in the case of optical sensors), the emission from the Earth (thermal sensors) or from an artificial energy beam of its own emission (radar sensors). In turn, this energy beam received and transformed into a signal by the sensor must be transmitted to the Earth’s surface to be analyzed and interpreted.
Remote sensing as a method of studying the environmental quality of a body of water has a series of advantages over in situ sampling methods. By being based on images, the observations are non-invasive, the cost of accessing the data is low, measurements can be had throughout the year using instruments that are regularly calibrated, and above all, they provide observations of the entire surface of the aquatic body, while taking data in situ only allows for specific sampling, the cost of which increases with the number of samples.
On the other hand, it presents certain limitations, because electromagnetic radiation only penetrates a few meters at most, below the surface of the water; In the near and mid-infrared the electromagnetic penetration does not reach centimeters.
From an ecological perspective, the term “water quality” refers to the state of the most important abiotic and biotic properties of the water column at a given time and place. The most important water quality parameters from a habitat management perspective are chlorophyll concentration and suspended sediment concentration, and these are also strongly linked to bathing and the quality of drinking water for human use.
Water transmits most of the visible energy that falls on it. Absorption increases as the wavelength of the incident radiation increases. The greatest reflectivity of clear water is around blue, decreasing when the near infrared is reached, and is related to depth, the content of suspended materials (chlorophyll, nutrients) and surface roughness. Thus, the spectral reflectivity increases in shallow waters due to the appreciable contribution of the bottom. In clear water the penetration depth is 10 m between 0.5 and 0.6μm falling to 10 cm at 0.8 – 1.1μm.
Therefore, as the depth of the water increases, the reflectance, at any wavelength, decreases, obtaining an image of the same “black”, since it absorbs all the radiation that reaches it in a few centimeters or millimeters, making it only possible to estimate the composition of surface water.
On the other hand, the amount of photosynthetic biomass present in the water, and therefore, the possible eutrophication problems of the lake, is directly related to the concentrations of nutrients in the water, nitrates and dissolved phosphates, mainly phosphorus, which is the limiting nutrient in continental waters and its concentration variations trigger algae.
Chlorophyll concentration is an indicator of the amount of algae, and therefore energy and biomass, entering the aquatic food web through photosynthesis. Since algal growth is often limited by nutrient availability, high chlorophyll concentrations are frequently the result of contamination from communal wastewater or agricultural runoff.
Suspended sediment can originate from currents or waves that move sediment from the bottom of the water (called re-suspension) or from tributary rivers that transport sediment as they flow. The amount of sediment in the water column also depends largely on grain size: fine-grained sediment can be picked up by slow currents and takes a long time to settle again, while larger-grained sediment is only moved by currents. very strong and deposits very quickly.
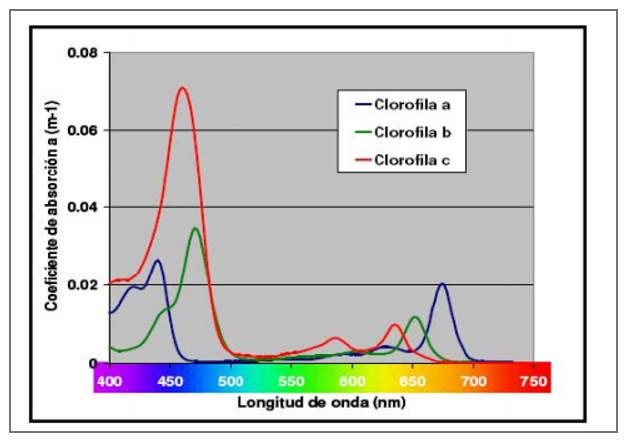
Phytoplankton have the ability to selectively absorb light in the visible region of the electromagnetic spectrum, between 400 and 700 nm wavelength, a region in which water hardly absorbs light. This makes phytoplankton largely responsible for the color of the water. It is one of the optically active components (OAC) in water bodies. Other OACs in waters are suspended mineral particles, phytoplankton dead organic matter and CDOM.
Satellite Data
The idea consists of the integration of satellite data coming mainly from the ESA to our application through a machine learning method which will process the data and provide statistical results and modeling using dynamic graphics.
This is a very useful tool for researchers and political actors to have the necessary information to mitigate the impact on the environment and comply with regulatory laws.
As data input to the system we will consider the Current Satellite Missions for Water Quality Monitoring:
● Landsat 7 (4/15/1999 – today)
● Landsat 8 (1/2/2013 – today)
● Terra (12/18/1999 – today)
● Aqua (4/5/2002 – today)
● Suomi National Polar Partnership
● (SNPP) (11/21/2011 – today)
● Sentinel-2A (6/23/2015 – today)
● Sentinel-2B (7/3/2017 – today)
● Sentinel-3A (2/16/2016 – today)
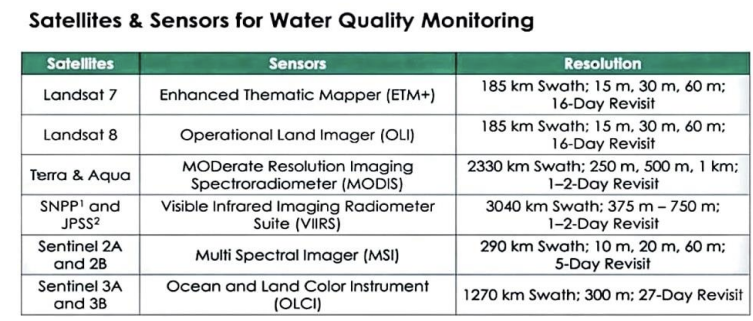
Water Quality is monitored with Remote Sensing, where optical and infrared bands are normally used. ETM+, OLI, MODIS, VIIRS, MSI and OLCI measurements cover optical and infrared ranges in different spectral bands. These measurements have been used to monitor water quality over high seas, coastal waters, estuaries, and inland lakes.
In the following table you can see the Satellites and their Sensors for Water Quality Monitoring:
Since there are several indicators of Water Quality Observable by Satellites, Chlorophyll-a (phytoplankton) is chosen.
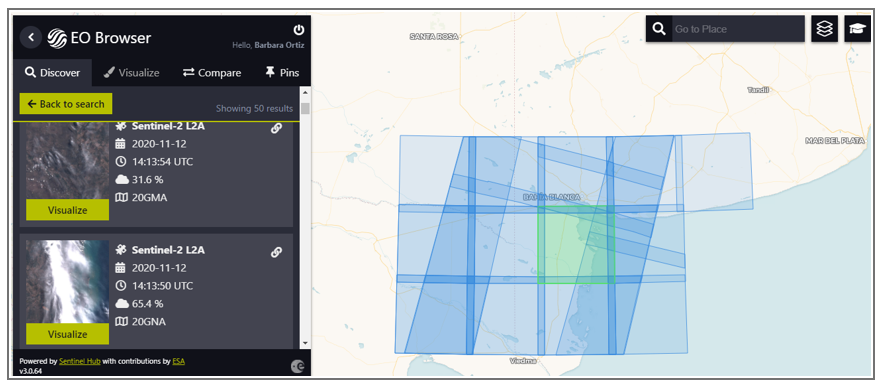
To use this data you can use the EO Browser browser. First we select the place, in this case Puerto Arenales, Buenos Aires, Argentina, then the satellite that covers the area and contains the data that interests us, according to the phenomenon to be studied. We chose Sentinel-2A. Enabling the cloud cover filter at 65%.
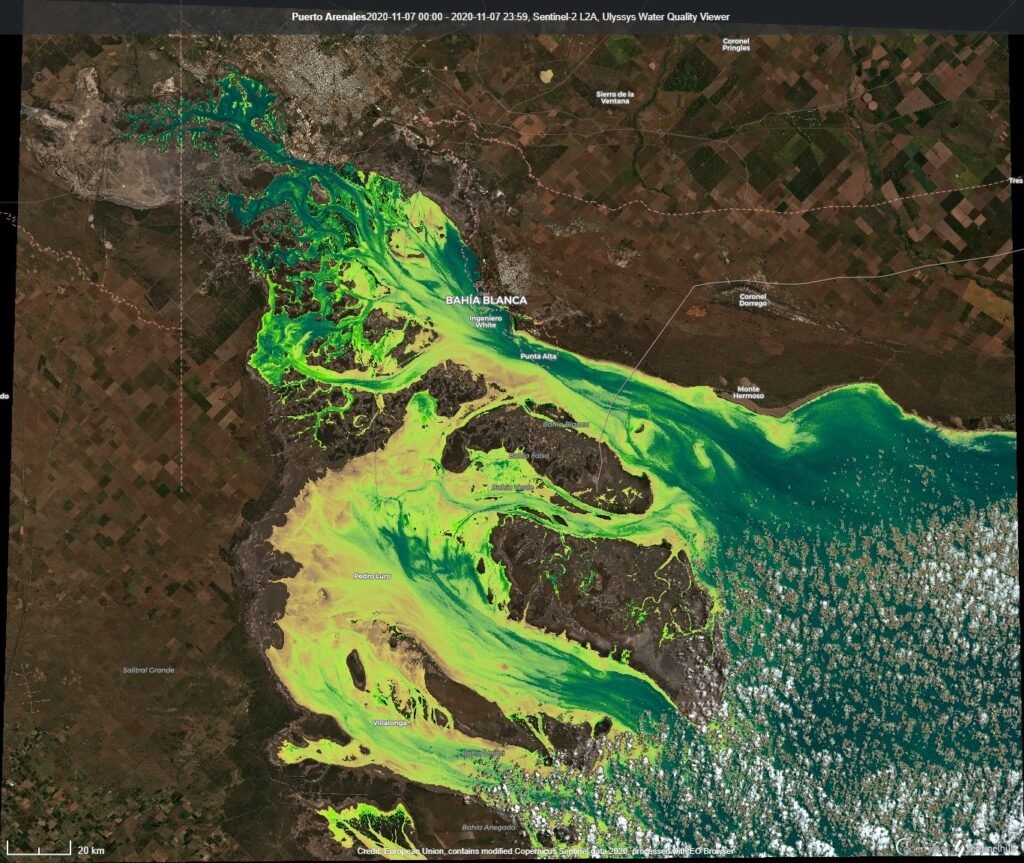
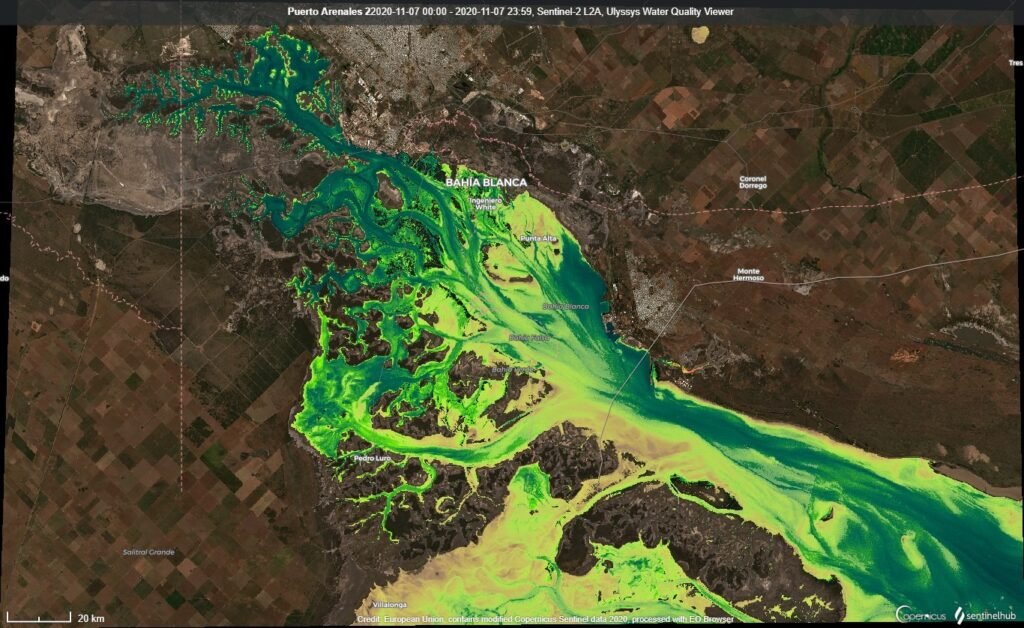
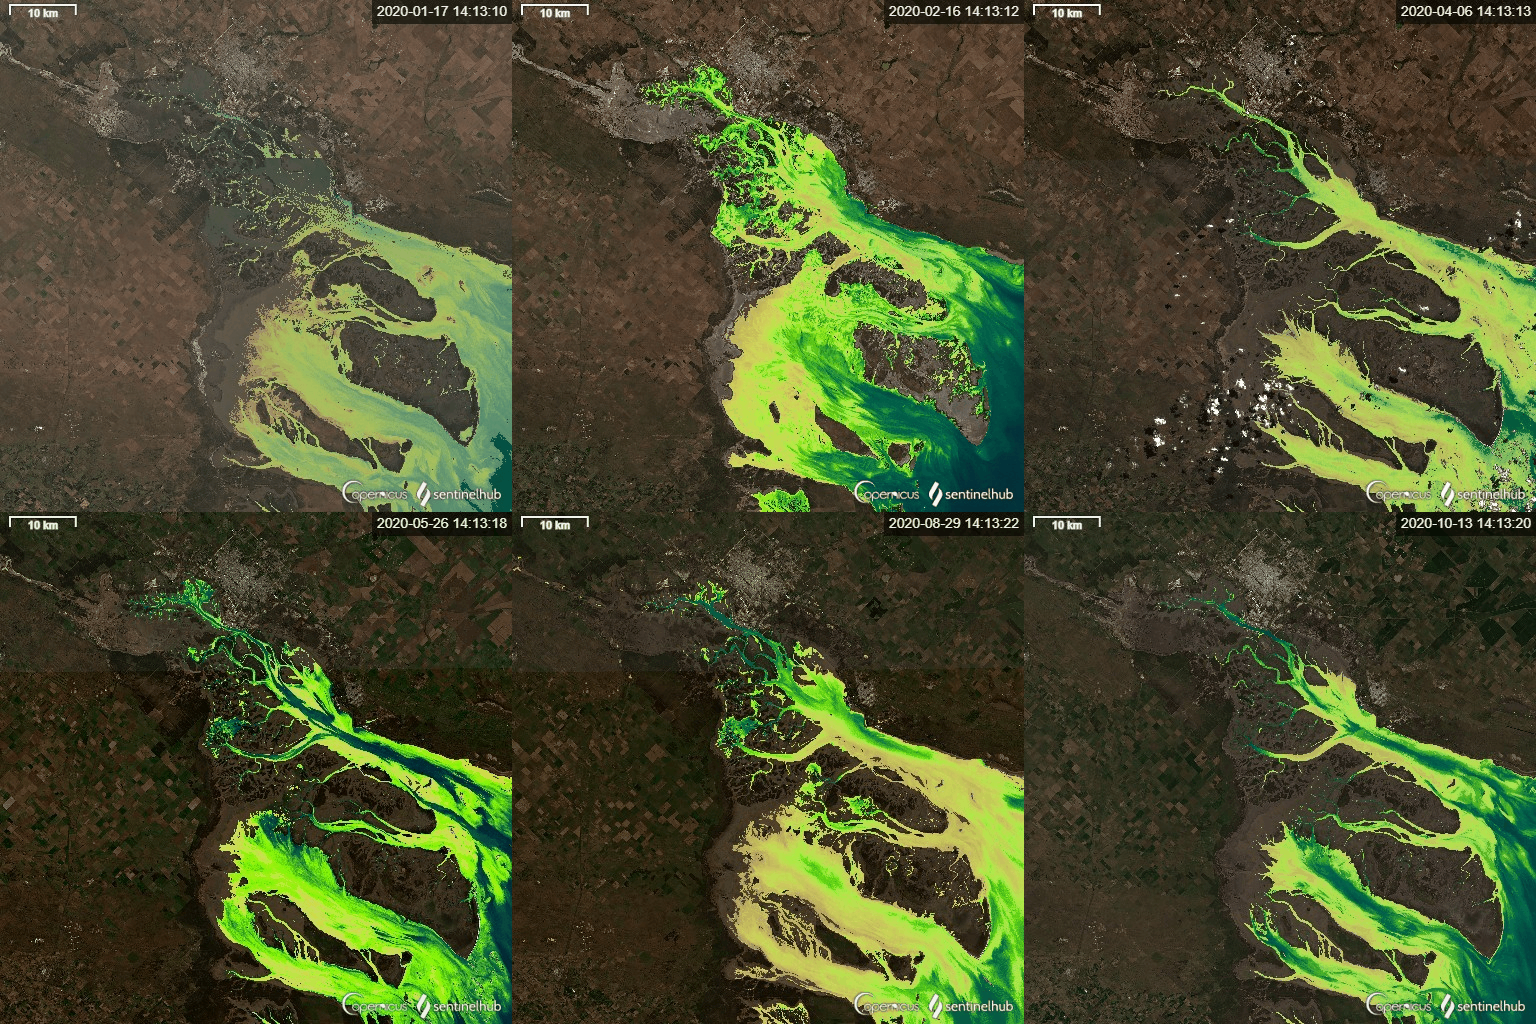
We used Ulyssys Water Quality Viewer (UWQV) which is a custom script for Sentinel-hub EO-Browser to dynamically visualize the chlorophyll and sediment conditions of water bodies in Sentinel-2 and Sentinel-3 images.
The visualization you see is the product of two masking operations and two visualizations of water quality parameters:
● cloud masking
● water masking
● visualization of suspended sediment concentration
● chlorophyll concentration display
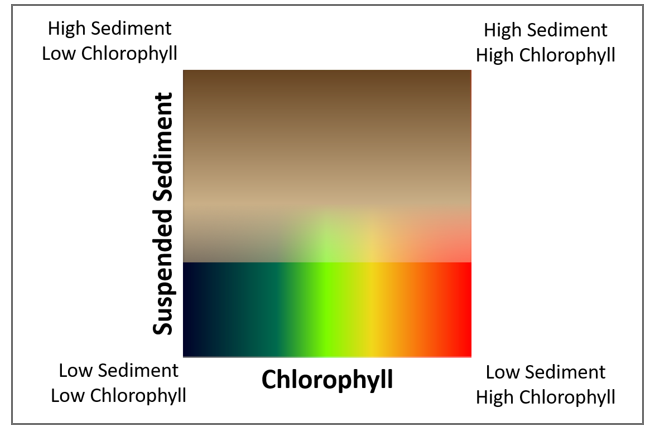
By default, all pixels identified as “non-water” (cloud, snow, or land) are displayed in true color. All pixels identified as water are colored with an algorithm that evaluates the concentration of chlorophyll and suspended sediment together. This visualization can be compared to a GIS map with two raster layers, sediment on top and chlorophyll on the bottom. The sediment “layer” is semi-transparent and may cover the chlorophyll “layer.” Like clouds in the atmosphere, sediment in water reduces transparency and obscures chlorophyll.
Therefore, water pixels with high sediment concentrations are colored dark brown regardless of their chlorophyll concentration. Medium sediment concentrations are wheat colored (light brown) with increasing transparency towards lower sediment concentrations. At low sediment concentrations, the sediment “layer” is completely transparent. Below the “layer” of semi-transparent sediment, the concentration of chlorophyll is visualized. High chlorophyll concentrations are marked in red, medium concentrations in green, and low concentrations in dark blue (see palette image below).
By changing the script input parameters it is also possible:
● display only sediments or only chlorophyll concentrations
● switch between various cloud and water masking algorithms (even turning off masking completely)
● Alter the default numerical thresholds (min/max values) to adjust the display to better suit local conditions
● render water (foreground) and/or non-water (background) pixels with the image true color or a single constant color with opacity.
In the future it is proposed to create a custom script considering the following factors:
1. How Light Interacts with Water

2. Inherent Optical Properties
a = absorption by:
- phytoplankton (ph)
- non-algal particles (nap)
- colored dissolved organic matter (CDOM)
- water (w)
b = forward (f) and backward (b) dispersion
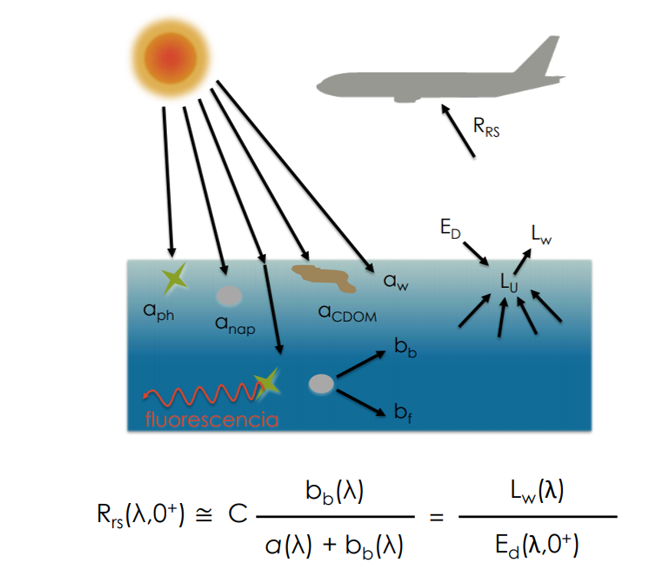
Where the absorption (a) of light is by phytoplankton (ph), non-algal particles (nap), water (w) and colored dissolved organic matter (CDOM)
a = aph + anap + aCDOM + aw
And the scattering (b) of light by particles forward (bf) and backward (bb)
b = bf + bb
In Situ measurements are necessary to build a dynamic threshold that adapts to the natural behavior of the variable, to automatically detect algae and chlorophyll blooms.
